
Quick view
What a waste worksheet 14-16
- 14+
- Waste
This worksheet accompanies the What a Waste lesson plan
This maths activity is all about how much food packaging we throw away in our homes and the importance of recycling.
Download (262 kb)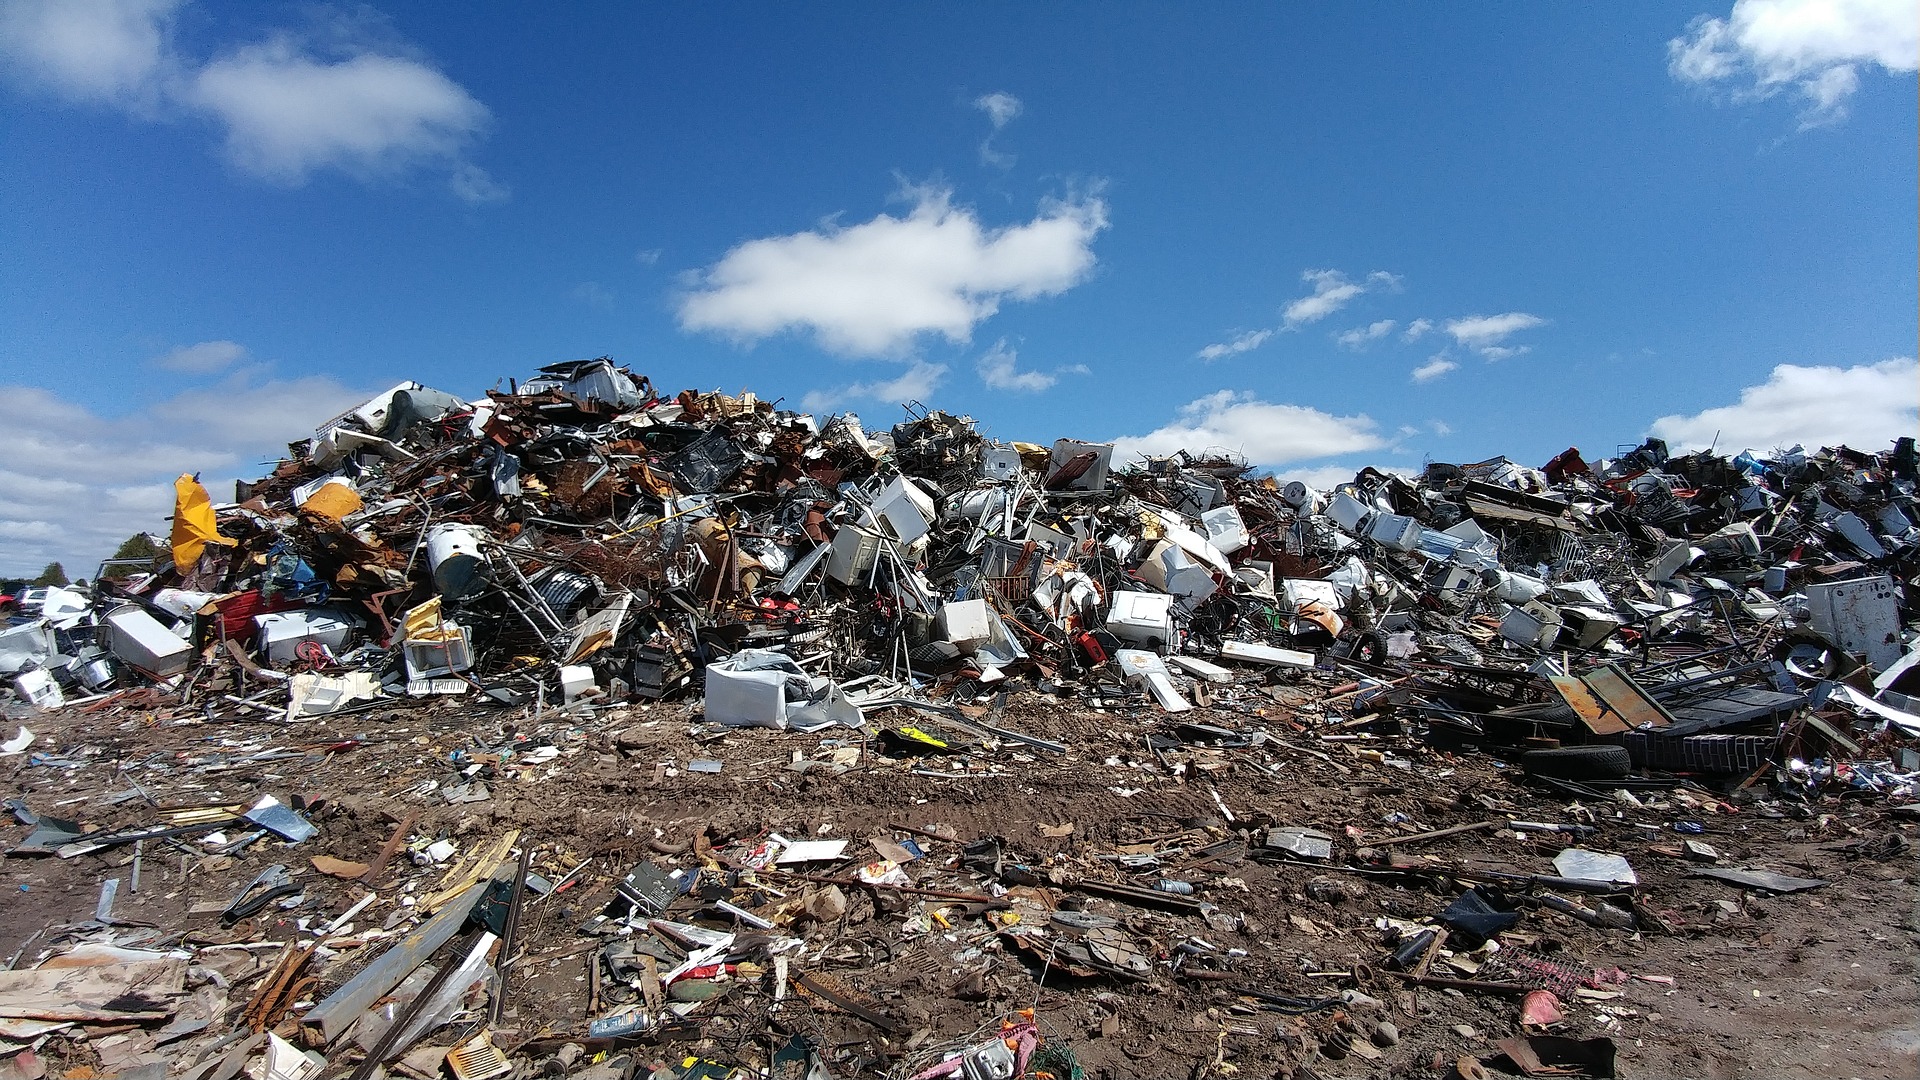
14-16s
AQA GCSE Mathematics
3.1 Number
3.1.1 Structure and calculation
N2
Basic foundation content:
apply the four operations, including formal written methods, to integers, decimals and simple fractions (proper and improper), and mixed numbers – all both positive and negative
N8
Additional foundation content:
Calculate exactly with multiples of
3.6 Statistics
S2
Basic foundation content:
interpret and construct tables, charts and diagrams, including frequency tables, bar charts, pie charts and pictograms for categorical data, vertical line charts for ungrouped discrete numerical data, and know their appropriate use
S4
Basic foundation content:
interpret, analyse and compare the distributions of data sets from univariate empirical distributions through:
· appropriate graphical representation involving discrete, continuous and grouped data
· appropriate measures of central tendency (median, mean, mode and modal class) and spread (range, including consideration of outliers)
AQA GCSE Statistics
3.1.2 A2
Basic foundation content:
Know the constraints that may be faced in designing an investigation to test a hypothesis: these may include factors such as time, costs, ethical issues, confidentiality and convenience etc.
3.1.3 A3
Basic foundation content:
Determine proactive strategies to mitigate issues that might arise during the statistical enquiry process. For example, dealing with difficulties in identifying the population, non-response issues or unexpected outcomes.
3.2.2 B1b
Basic foundation content:
Know the advantages and implications of merging data into more general categories, and of grouping numerical data into class intervals.
3.2.7 B2d
Additional foundation content:
Determine factors that may lead to bias, including issues of sensitivity of the content matter, and know how to minimise data distortion.
3.3.1 C1a
Basic foundation content:
Represent data sets pictorially using calculated key values as necessary, and interpret and compare data sets displayed pictorially as:
· tabulation
· tally
· pictogram
Additional foundation content:
Represent data sets pictorially using calculated key values as necessary, and interpret and compare data sets displayed pictorially as:
· pie chart
· stem and leaf diagram
· Venn diagram
3.3.7 C4b
Basic foundation content:
Select appropriate form of representation.
Additional foundation content:
Select and justify appropriate form of representation with regard to the nature of data.
3.4.1 D1a
Basic foundation content:
Calculate averages for discrete and grouped data:
· Mode
· Median
· Arithmetic mean.
Higher content only:
Calculate averages for discrete and grouped data:
· Weighted mean
3.4.1 D1b
Additional foundation content:
Justify the rationale for selecting appropriate types of average in context.
3.4.4 D3a
Basic foundation content:
Calculate different measures of spread:
· range
3.4.6 D4
Basic foundation content:
Identify trends in data through inspection.
3.5.7 E3a
Basic foundation content:
Compare different data sets using appropriate calculated or given measure of central tendency: mode, modal group, median and mean.
3.5.8 E3b
Basic foundation content:
Compare different data sets using appropriate calculated or given measure of spread: range.
3.5.10 E3d
Basic foundation content:
Interpret data presented in a variety of tabular forms.
3.5.35 E13a
Basic foundation content:
Know that sample size has an impact on reliability and replication.
Edexcel GCSE (9-1) Mathematics
Foundation tier knowledge, skills and understanding
1. Number
Structure and calculation
N2
apply the four operations, including formal written methods, to integers, decimals and simple fractions (proper and improper), and mixed numbers – all both positive and negative; understand and use place value (e.g. when working with very large or very small numbers, and when calculating with decimals)
2. Algebra
Notation, vocabulary and manipulation
A2
substitute numerical values into formulae and expressions, including scientific formulae
6. Statistics
S2
interpret and construct tables, charts and diagrams, including frequency tables, bar charts, pie charts and pictograms for categorical data, vertical line charts for ungrouped discrete numerical data, tables and line graphs for time series data and know their appropriate use
S4
interpret, analyse and compare the distributions of data sets from univariate empirical distributions through:
o appropriate graphical representation involving discrete, continuous and grouped data
o appropriate measures of central tendency (median, mean, mode and modal class) and spread (range, including consideration of outliers)
Higher tier knowledge, skills and understanding
1. Number
Structure and calculation
N2
apply the four operations, including formal written methods, to integers, decimals and simple fractions (proper and improper), and mixed numbers – all both positive and negative; understand and use place value (e.g. when working with very large or very small numbers, and when calculating with decimals)
2. Algebra
Notation, vocabulary and manipulation
A2
substitute numerical values into formulae and expressions, including scientific formulae
6. Statistics
S2
interpret and construct tables, charts and diagrams, including frequency tables, bar charts, pie charts and pictograms for categorical data, vertical line charts for ungrouped discrete numerical data, tables and line graphs for time series data and know their appropriate use
S4
interpret, analyse and compare the distributions of data sets from univariate empirical distributions through:
o appropriate graphical representation involving discrete, continuous and grouped data, including box plots
o appropriate measures of central tendency (median, mean, mode and modal class) and spread (range, including consideration of outliers, quartiles and inter-quartile range)
S6
use and interpret scatter graphs of bivariate data; recognise correlation and know that it does not indicate causation; draw estimated lines of best fit; make predictions; interpolate and extrapolate apparent trends while knowing the dangers of so doing
Edexcel GCSE Statistics
Foundation tier content
1. The collection of data
a) Planning
1a.01 Know that a hypothesis can be tested only through the appropriate collection and analysis of data.
1a.03 Determine proactive strategies to mitigate issues that might arise during the statistical enquiry process.
b) Types of data
1b.02 Know the advantages and implications of merging data into more general categories, and of grouping numerical data into class intervals
d) Collecting data
1d.04 Know the key features to be considered when planning data collection: leading questions, avoiding biased sources, time factors, open/closed questions, different types of interview technique.
1d.05 Know and demonstrate understanding of techniques used to deal with problems that may arise with collected data.
2. Processing, representing and analysing data
a) Tabulation, diagrams and representation
2a.01 Represent data sets pictorially using calculated key values as necessary, and interpret and compare data sets displayed pictorially: tabulation, tally, pictogram, pie chart, stem and leaf diagram, Venn diagram.
2a.03 Represent data sets graphically using calculated key values as necessary, and interpret and compare data sets displayed graphically: bar charts, line graphs, time series, scatter diagrams, bar line (vertical line) charts, frequency polygons, cumulative frequency (discrete and grouped) charts, histograms (equal class width), and box plots.
b) Measures of central tendency
2b.01 Calculate averages for discrete and grouped data: mode, median, arithmetic mean.
The term ‘mean’ should be understood to be ‘arithmetic mean’.
2b.02 Justify the rationale for selecting appropriate types of average in context.
2b.03 Compare different data sets using appropriate calculated or given measure of central tendency: mode, modal class, median and mean.
c) Measures of dispersion
2c.01 Calculate different measures of spread: range, quartiles, interquartile range (IQR), percentiles.
2c.04 Compare different data sets using appropriate calculated or given measure of spread: range, interquartile range (IQR), percentiles.
Higher tier content
1. The collection of data
a) Planning
1a.01 Know that a hypothesis can be tested only through the appropriate collection and analysis of data.
1a.03 Determine proactive strategies to mitigate issues that might arise during the statistical enquiry process.
b) Types of data
1b.02 Know the advantages and implications of merging data into more general categories, and of grouping numerical data into class intervals.
d) Collecting data
1d.03 Determine factors that may lead to bias, including issues of sensitivity of the content matter, level of control and know how to minimise data distortion.
1d.05 Know and demonstrate understanding of techniques used to deal with problems that may arise with collected data.
2. Processing, representing and analysing data
a) Tabulation, diagrams and representation
2a.01 Represent data sets pictorially using calculated key values as necessary, and interpret and compare data sets displayed pictorially: tabulation, tally, pictogram, pie chart, stem and leaf diagram, Venn diagram.
2a.03 Represent data sets graphically using calculated key values as necessary, and interpret and compare data sets displayed graphically: bar charts, line graphs, time series, scatter diagrams, bar line (vertical line) charts, frequency polygons, cumulative frequency (discrete and grouped) charts, histograms (equal class width), and box plots.
b) Measures of central tendency
2b.01 Calculate averages for discrete and grouped data: mode, median, arithmetic mean, weighted mean, geometric mean, mean seasonal variation.
The term ‘mean’ should be understood to be ‘arithmetic mean’ unless ‘geometric mean’ is stated.
2b.02 Justify the rationale for selecting appropriate types of average in context.
2b.03 Compare different data sets using appropriate calculated or given measure of central tendency: mode, modal class, median and mean.
c) Measures of dispersion
2c.01 Calculate different measures of spread: range, quartiles, interquartile range (IQR), percentiles, interpercentile range, interdecile range and standard deviation.
2c.04 Compare different data sets using appropriate calculated or given measure of spread: range, interquartile range (IQR), percentiles and standard deviation.
WJEC GCSE in Mathematics – Numeracy
Foundation tier
Number
Understanding number and place value
Reading and writing whole numbers of any magnitude expressed in figures or words.
Understanding number relationships and methods of calculation
Using addition, subtraction, multiplication, division, square and square root.
Solving numerical problems
Interpretation and use of mathematical information presented in written or visual form when solving problems, e.g. TV programme schedules, bus/rail timetables, distance charts, holiday booking information.
Understanding and using equations and formulae
Substitution of positive and negative whole numbers, fractions and decimals into simple formulae expressed in words or in symbols.
Statistics
Understanding and using the statistical problem solving process: specifying the problem/planning; collecting, processing and representing data; interpreting and discussing results.
Processing, representing and interpreting data
Sorting, classification and tabulation of qualitative (categorical) data, discrete or continuous quantitative data.
Constructing and interpreting pictograms, bar charts and pie charts for qualitative data. Constructing and interpreting vertical line diagrams for discrete data.
Constructing line graphs for the values of a variable at different points in time; understanding that intermediate values in a line graph may or may not have meaning.
Simple cases of constructing and interpreting grouped frequency diagrams.
Mean, median and mode for a discrete (ungrouped) frequency distribution.
Comparison of two distributions using one measure of central tendency (i.e. the mean or the median).
Modal category for qualitative data. Modal class for grouped data.
Calculating or estimating the range applied to discrete data.
Discussing results
Recognising that graphs may be misleading.
Looking at data to find patterns and exceptions.
Intermediate tier
Number
Understanding number and place value
Reading and writing whole numbers of any magnitude expressed in figures or words.
Understanding number relationships and methods of calculation
Using addition, subtraction, multiplication, division, square, square root, power, root, constant, memory, brackets and appropriate statistical functions.
Solving numerical problems
Interpretation and use of mathematical information presented in written or visual form when solving problems, e.g. TV programme schedules, bus/rail timetables, distance charts, holiday booking information.
Giving solutions in the context of a problem, selecting an appropriate degree of accuracy, interpreting the display on a calculator, and recognising limitations on the accuracy of data and measurements.
Algebra
Understanding and using equations and formulae
Substitution of positive and negative whole numbers, fractions and decimals into simple formulae expressed in words or in symbols.
Statistics
Understanding and using the statistical problem solving process: specifying the problem/planning; collecting, processing and representing data; interpreting and discussing results.
Specifying the problem and planning
Considering the effect of sample size and other factors that affect the reliability of conclusions drawn.
Processing, representing and interpreting data
Sorting, classification and tabulation of qualitative (categorical) data, discrete or continuous quantitative data.
Constructing and interpreting pictograms, bar charts and pie charts for qualitative data. Constructing and interpreting vertical line diagrams for discrete data.
Constructing line graphs for the values of a variable at different points in time; understanding that intermediate values in a line graph may or may not have meaning.
Constructing and interpreting grouped frequency diagrams and frequency polygons.
Constructing and interpreting cumulative frequency tables and diagrams using the upper boundaries of the class intervals.
Selecting and using an appropriate measure of central tendency.
Mean, median and mode for a discrete (ungrouped) frequency distribution.
Estimates for the median and mean of grouped frequency distributions.
Comparison of two distributions using one measure of central tendency (i.e. the mean or the median) and/or one measure of spread.
Modal category for qualitative data. Modal class for grouped data.
Selecting and calculating or estimating appropriate measures of spread, including the range and interquartile range applied to discrete, grouped and continuous data.
Discussing results
Recognising that graphs may be misleading.
Looking at data to find patterns and exceptions.
Higher tier
Number
Understanding number and place value
Reading and writing whole numbers of any magnitude expressed in figures or words.
Understanding number relationships and methods of calculation
Using addition, subtraction, multiplication, division, square, square root, power, root, constant, memory, brackets and appropriate statistical functions.
Addition, subtraction, multiplication and division of whole numbers, decimals, fractions and negative numbers.
Solving numerical problems
Interpretation and use of mathematical information presented in written or visual form when solving problems, e.g. TV programme schedules, bus/rail timetables, distance charts, holiday booking information.
Giving solutions in the context of a problem, selecting an appropriate degree of accuracy, interpreting the display on a calculator, and recognising limitations on the accuracy of data and measurements.
Algebra
Understanding and using equations and formulae
Substitution of positive and negative whole numbers, fractions and decimals into simple formulae expressed in words or in symbols.
Statistics
Understanding and using the statistical problem solving process: specifying the problem/planning; collecting, processing and representing data; interpreting and discussing results.
Specifying the problem and planning
Considering the effect of sample size and other factors that affect the reliability of conclusions drawn.
Processing, representing and interpreting data
Sorting, classification and tabulation of qualitative (categorical) data, discrete or continuous quantitative data.
Constructing and interpreting pictograms, bar charts and pie charts for qualitative data. Constructing and interpreting vertical line diagrams for discrete data.
Constructing line graphs for the values of a variable at different points in time; understanding that intermediate values in a line graph may or may not have meaning.
Constructing and interpreting grouped frequency diagrams and frequency polygons.
Constructing and interpreting cumulative frequency tables and diagrams using the upper boundaries of the class intervals.
Selecting and using an appropriate measure of central tendency.
Mean, median and mode for a discrete (ungrouped) frequency distribution.
Estimates for the median and mean of grouped frequency distributions.
Comparison of two distributions using one measure of central tendency (i.e. the mean or the median) and/or one measure of spread.
Modal category for qualitative data. Modal class for grouped data.
Selecting and calculating or estimating appropriate measures of spread, including the range and interquartile range applied to discrete, grouped and continuous data.
Discussing results
Recognising that graphs may be misleading.
Looking at data to find patterns and exceptions.
CCEA GCSE in Mathematics
Unit M1: Foundation Tier
Number and algebra
Students should be able to:
· use the 4 operations applied to positive and negative integers, including efficient written methods;
· substitute numbers into formulae (which may be expressed in words or algebraically) and expressions;
· use standard formulae;
· construct and interpret linear graphs in real world contexts.
Handling data
Students should be able to:
· identify possible sources of bias;
· sort, classify and tabulate qualitative (categorical) data and discrete or continuous quantitative data, including the use of 2 circle Venn diagrams to sort data;
· extract data from printed tables and lists;
· find mean, median, mode and range from a list of values and understand their uses; and
· calculate mean from an ungrouped frequency table and identify the mode and median.
· construct and interpret a wide range of graphs and diagrams including frequency tables and diagrams, pictograms, bar charts, pie charts, line graphs, frequency trees and flow charts, recognising that graphs may be misleading;
· examine data to find patterns and exceptions;
· compare distributions and make inferences;
Unit M2: Foundation Tier
Handling data
Students should be able to:
· estimate mean from a grouped frequency distribution;
· identify the modal class and the median class from a grouped frequency distribution;
CCEA GCSE in Further Mathematics
Unit 3: Statistics
Central tendency and dispersion
Students should be able to:
· calculate the mean and standard deviation from data or estimates of these from grouped data;
SQA National 4 Mathematics
Numeracy (National 4)
Outcome 1
The learner will:
1 Use numerical skills to solve straightforward, real-life problems involving money/time/measurement by:
1.1 Selecting and using appropriate numerical notation and units
1.2 Selecting and carrying out calculations
Outcome 2
The learner will:
2.1 Extracting and interpreting data from at least two different straightforward graphical forms
2.2 Making and explaining decisions based on the interpretation of data
Mathematics: Expressions and Formulae (National 4)
Outcome 1
The learner will:
1 Use mathematical operational skills linked to expressions and formulae by:
1.3 Applying statistical skills to representing and analysing data
Outcome 2
The learner will:
2 Use mathematical reasoning skills linked to expressions and formulae by:
2.1 Interpreting a situation where mathematics can be used and identifying a valid strategy
2.2 Explaining a solution and/or relating it to context
Mathematics: Relationships (National 4)
Outcome 1
The learner will:
1 Use mathematical operational skills linked to relationships by:
1.4 Applying statistical skills to representing data
Outcome 2
The learner will:
2 Use mathematical reasoning skills linked to relationships by:
2.1 Interpreting a situation where mathematics can be used and identifying a valid strategy
2.2 Explaining a solution and/or relating it to context
Mathematics: Test (National 4)
Applying statistical skills to representing and analysing data and to probability
Constructing a frequency table with class intervals from raw data
· Using ungrouped data
Determining statistics of a data set
· Mean
· Median
· Mode
· Range
Interpreting calculated statistics
· Using mean, median, mode, range to compare data sets
Representing raw data in a pie chart
· Calculation of sector angles for given categories
Interpreting graphical data and situations involving probability to solve straightforward real-life problems involving money/time/ measurement
Extracting and interpreting data from straightforward graphical forms
Straightforward graphical forms should include:
· a table with at least four categories of information
· a chart where the values are given or where the scale is obvious, eg pie
· a graph where the scale is obvious, eg bar, pie, scatter or line graph
· a diagram, eg stem and leaf, map or plan
Making and explaining decisions based on the interpretation of data
· make decisions based on observations of patterns and trends in data
· make decisions based on calculations involving data
· make decisions based on reading scales in straightforward graphical forms
· offer reasons for the decisions made based on the interpretation of data